Functionality
Let’s take a look at FreeFlow
- Evaluation requires pilot prototyping on a limited area
- customer management autonomy analysis (stand-alone, trust, external support, accountants firm)
- dimensional mapping analysis
- dimensional depth analysis (Lod-Loi)
- evaluation of the type of application and related activities
PROTOTIPO
Definition of the customer’s wishes (URS)
Through a prototype developed on a limited area, the customer can appreciate the advantages that this method brings to their company. In this phase, the following are defined:
- The levels of information (LOI) that the virtual system will have to support
- The level of 3D graphic representation (LOD) will therefore be proportionate to this request
- Indicatively LOD3 or 4 (UNI 11337 standard)
- The areas to be mapped (floors, technical rooms, courtyards, warehouses, offices, production areas …) and the most suitable scanning technique
- The choice of the most suitable application for the customer’s business, for example:
- Maintenance focus
- Real estate management focus
- Focus cost of the analytical process
- Other…
This step therefore allows the exact definition of the times and costs offered by avoiding waste
STEP 1
Mapping of the areas
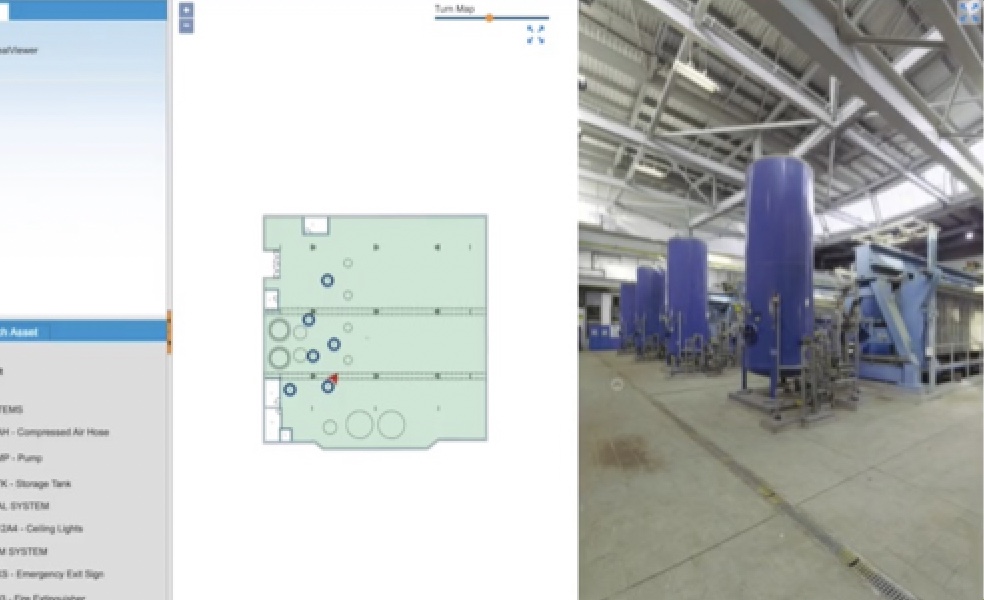
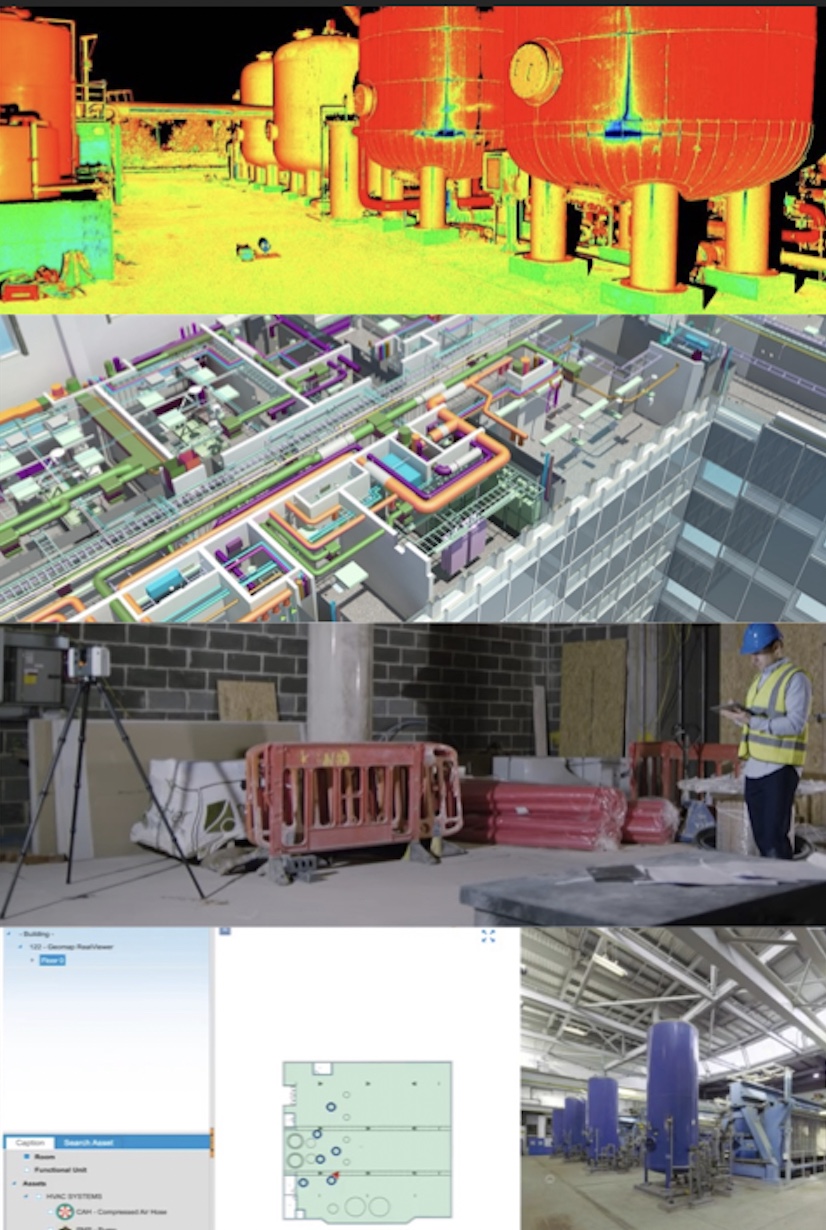
- The internal-external environments are detected with suitably parameterized laser-scan technique and in high definition
- The laser “point cloud” is generated which reproduces all the spaces in 3D
- It is configured and then loaded into the software to allow dynamic visual navigation (ex. Street view)
The various business areas are detected through high-definition laser scans, for this activity various types of instrumentation are used, from portable Cams to drones.
In this way the point cloud of the survey is obtained, suitably parameterized to be then correctly mapped.
In the meantime, the display of the scanned areas is available, through photos and relative navigation
STEP 2
Predefining personal data encodings and attributes
In this phase the categories and related drop attributes are loaded.
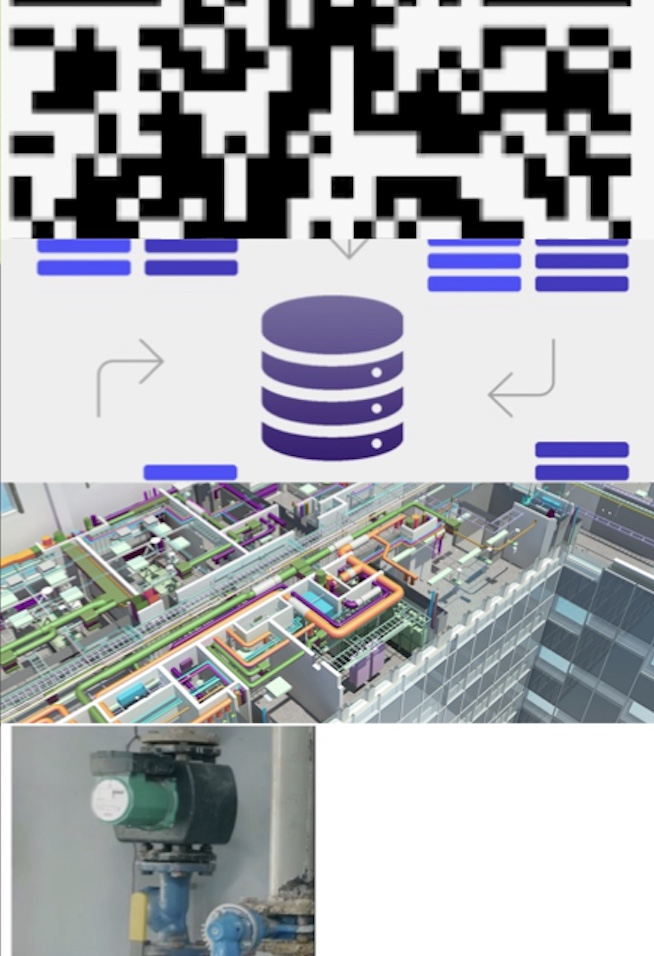
In this way, every visible object will have:
- Unique coding
- Unique category and related management attributes unique QR
- Unique card, for entering information and attachments (safety data sheets, manuals, technical info, assembly or cleaning sets, purchase invoices, reports (maintenance, internal or external), work documents, etc.)
- Rfid, for objects that require positioning and / or path identification
All information can be loaded into the same IFC database, or left in the pre-existing management systems and through direct links appropriately consulted. If you choose not to transfer the information, it is sufficient to index the various pre-existing management systems, simply by inserting the unique code in them (in this way there are no significant impacts on the activities of the personnel involved),
In this phase it is recommended to start the paperless if it is not already active.
Each paper document is then scanned and added to the database for final archiving and easy final accounting.
- The areas, buildings, structures, systems and objects are uniquely identified and geolocated. in this phase the primary categorization logics are assembled
- The info contained in external software (ERP, MES, CRM, Excel …) can flow into the same model or be indexed to it
- Optional: Objects can be tagged QR code
STEP 3
BIM model
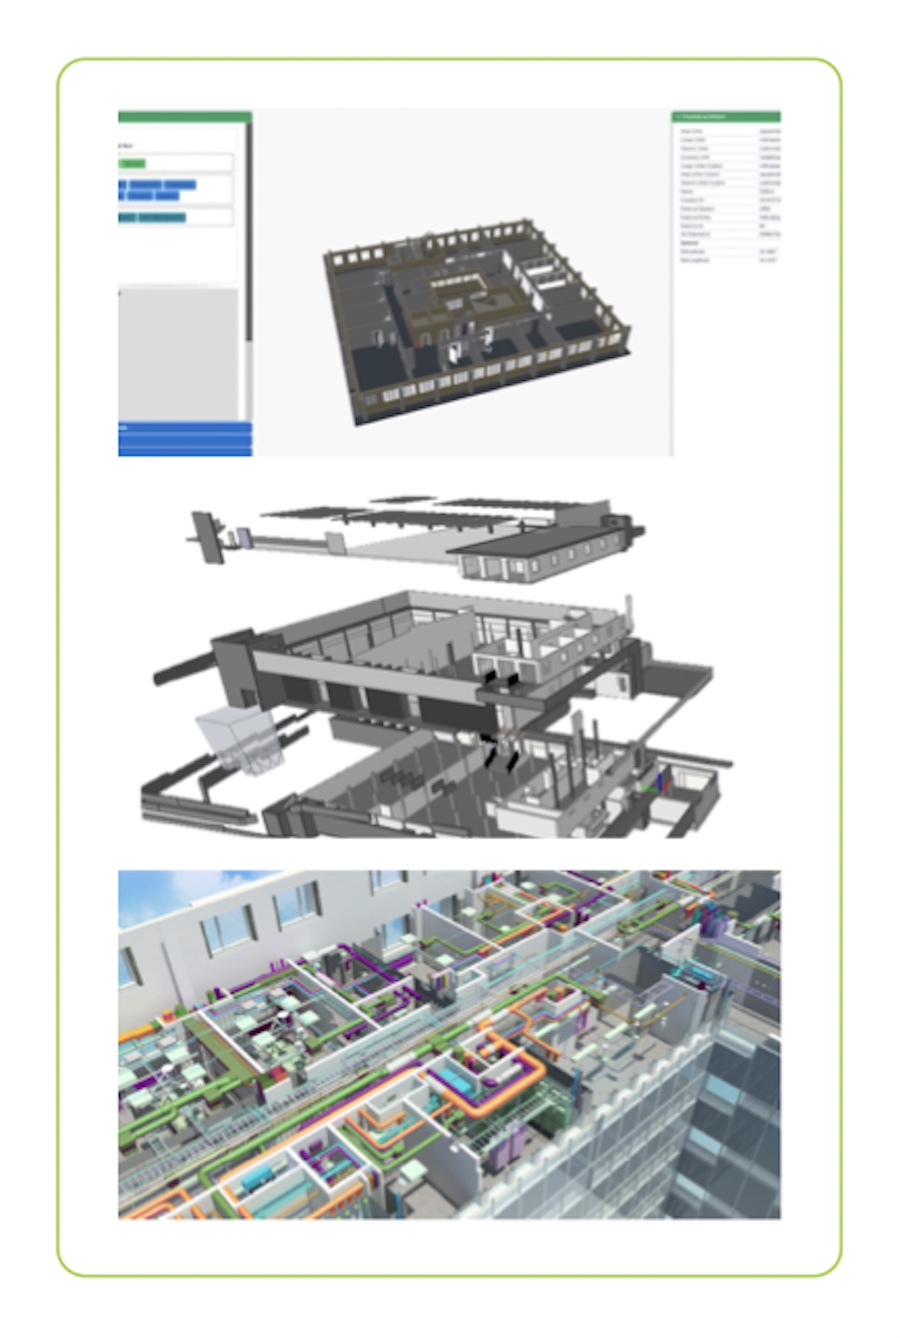
In this phase, the processing of the point cloud and the insertion of the registry structure: allows the obtaining of the BIM model with the required LOI-LOD levels, thus allowing a second virtual navigation in the company in addition to the photos (step 2) .
- Creation of BIM model according to. UNI11337 and the desired customer.
- Loading existing personal data and starting paper less activities.
- The company can now be not only navigated but also broken down and modeled in its contained info.
STEP 4
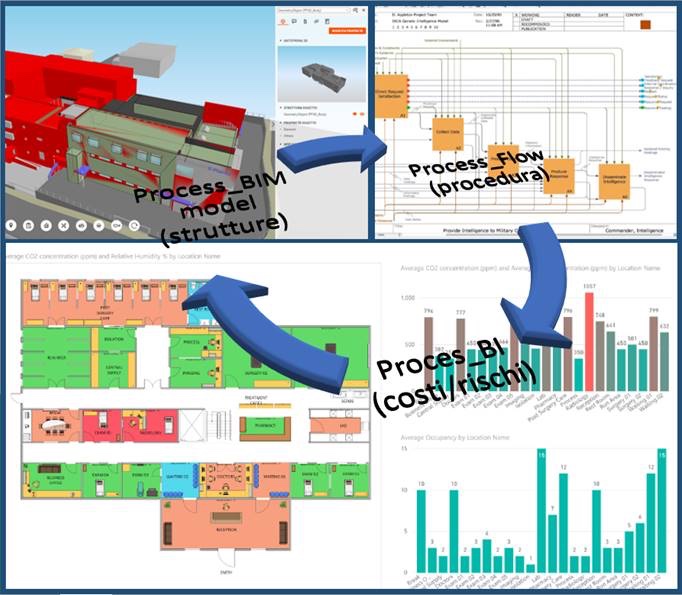
Process Control
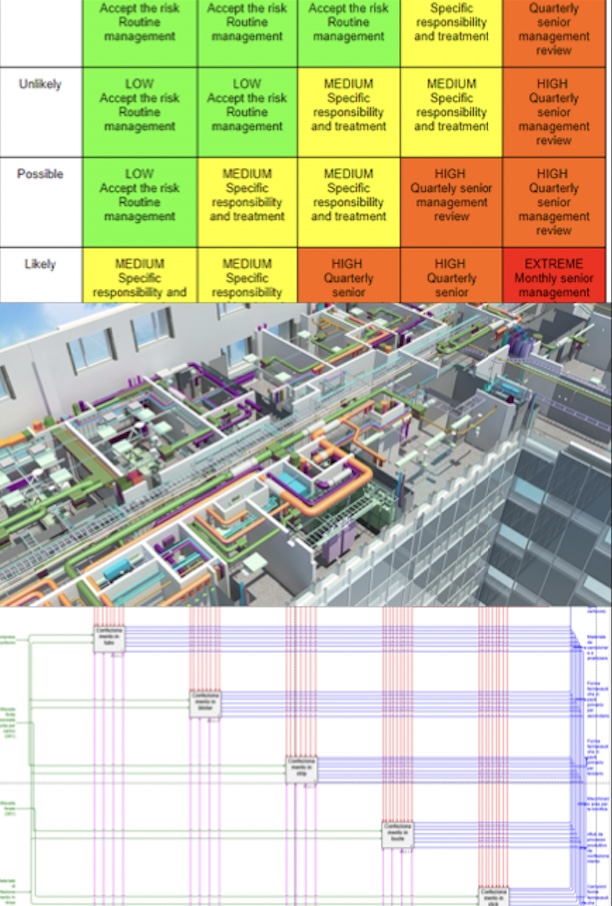
In this step, significant business processes are identified. By involving the operators directly, the following are mapped, using standard methods:
- Fmeca analysis flow mappings, (and risk analysis tools)
- AHP analysis
- Lean tools and industrial statistics
- Other…
Which have been modeled to be compatible with the BIM model and their coding-attributes.
In fact, by selecting the work process in the BIM model, the following are identified for each phase:
- Machining centers
- Direct and indirect personnel
- Indirect and indirect plants (utility example)
- Consumption
By adding the sets and specific process materials you get the complete mapping via value stream map.
- The most important processes are mapped (80% Pareto active and passive cycle) by integrating and categorizing all the information in the 3D model
- Risk analysis techniques (security and business) and Lean manutacturing are applied to balance the processes and then model them in an integrated way.
STEP 5
Data analysis
The BIM structure and its correlated master data allows to analyze the process in all its parameters identifying exactly the costs and waste.
Through modeling, the process can be virtually reset to obtain greater quality and profitability.
Finally, it should be noted that this activity has a very important added value, as it allows the management and direct staff:
– A unique virtual company view
– A unique communication method
– A view of the unknown process constraints
– A vision always focused on the quality and margins of the process.
- Standard work stations are predefined
- Control analyzes and business modeling are then prepared to simulate the fallout in the security-business area with estimated cash flows
